Bringing Watershed Data to Life with New Visualization Tool
November 20, 2024Living Lakes Canada acknowledges that this project is taking place in the unceded traditional territories of the Ktunaxa, Lheidli T’enneh, Secwepemc, Sinixt and Syilx Nations who have stewarded these lands for generations.
On the surface, Canada appears rich in freshwater. Yet, as communities across the country continue to face increasing water scarcity, it’s clear that more water data is needed to understand and sustainably manage freshwater sources. Water data provides essential information to support local climate adaptation efforts and inform decision making on freshwater use. Safe, centralized repositories are a vital component in the water security puzzle, providing secure data storage and easy access for those who need it. Living Lakes Canada’s Columbia Basin Water Hub is specifically designed to address this need effectively.
The Water Hub brings together over 400 datasets and seven million data points from over 50 contributors. This extensive water data covers lakes, streams, wetlands, snow, glaciers, and more. The data is collected by stewardship groups, governments, consultants, and industry. As a strong regional data model within the national data landscape, the Water Hub’s success stems from meeting contributors where they’re at and providing tailored support to meet specific user needs.
Since receiving the Open Data Quality Award from the Canadian Open Data Society in 2023, the Water Hub has continued to evolve to meet the expectations of its data users and contributors. Most recently, with support from Living Lakes partner Link Digital, a global leader in CKAN and open data solutions, the Water Hub has launched an entry-level data visualization tool to better serve the data community.

Enhanced Data Visualization for Watershed Insights
In response to user feedback, Link Digital developed a custom graphing tool to create an interactive and accessible data experience. Designed with the Water Hub’s community of users in mind, this easy-to-use tool transforms raw data into clear, compelling visuals. It helps users tell meaningful data stories that can deepen community engagement and effectively inform decision making. The new visualization capabilities allow users to better understand the data they collect, spot preliminary trends, and effectively communicate findings with wider audiences, especially those without a scientific background.
“These graphing upgrades are a real bonus to groups like the Rossland Streamkeepers. With the ability to layer multiple years of data, it allows us, and anyone interested in our water data, to easily visualize year-over-year trends and gain high-level insights into the changes happening in our watershed.” – Bill Coedy, Project Manager with the Rossland Streamkeepers.
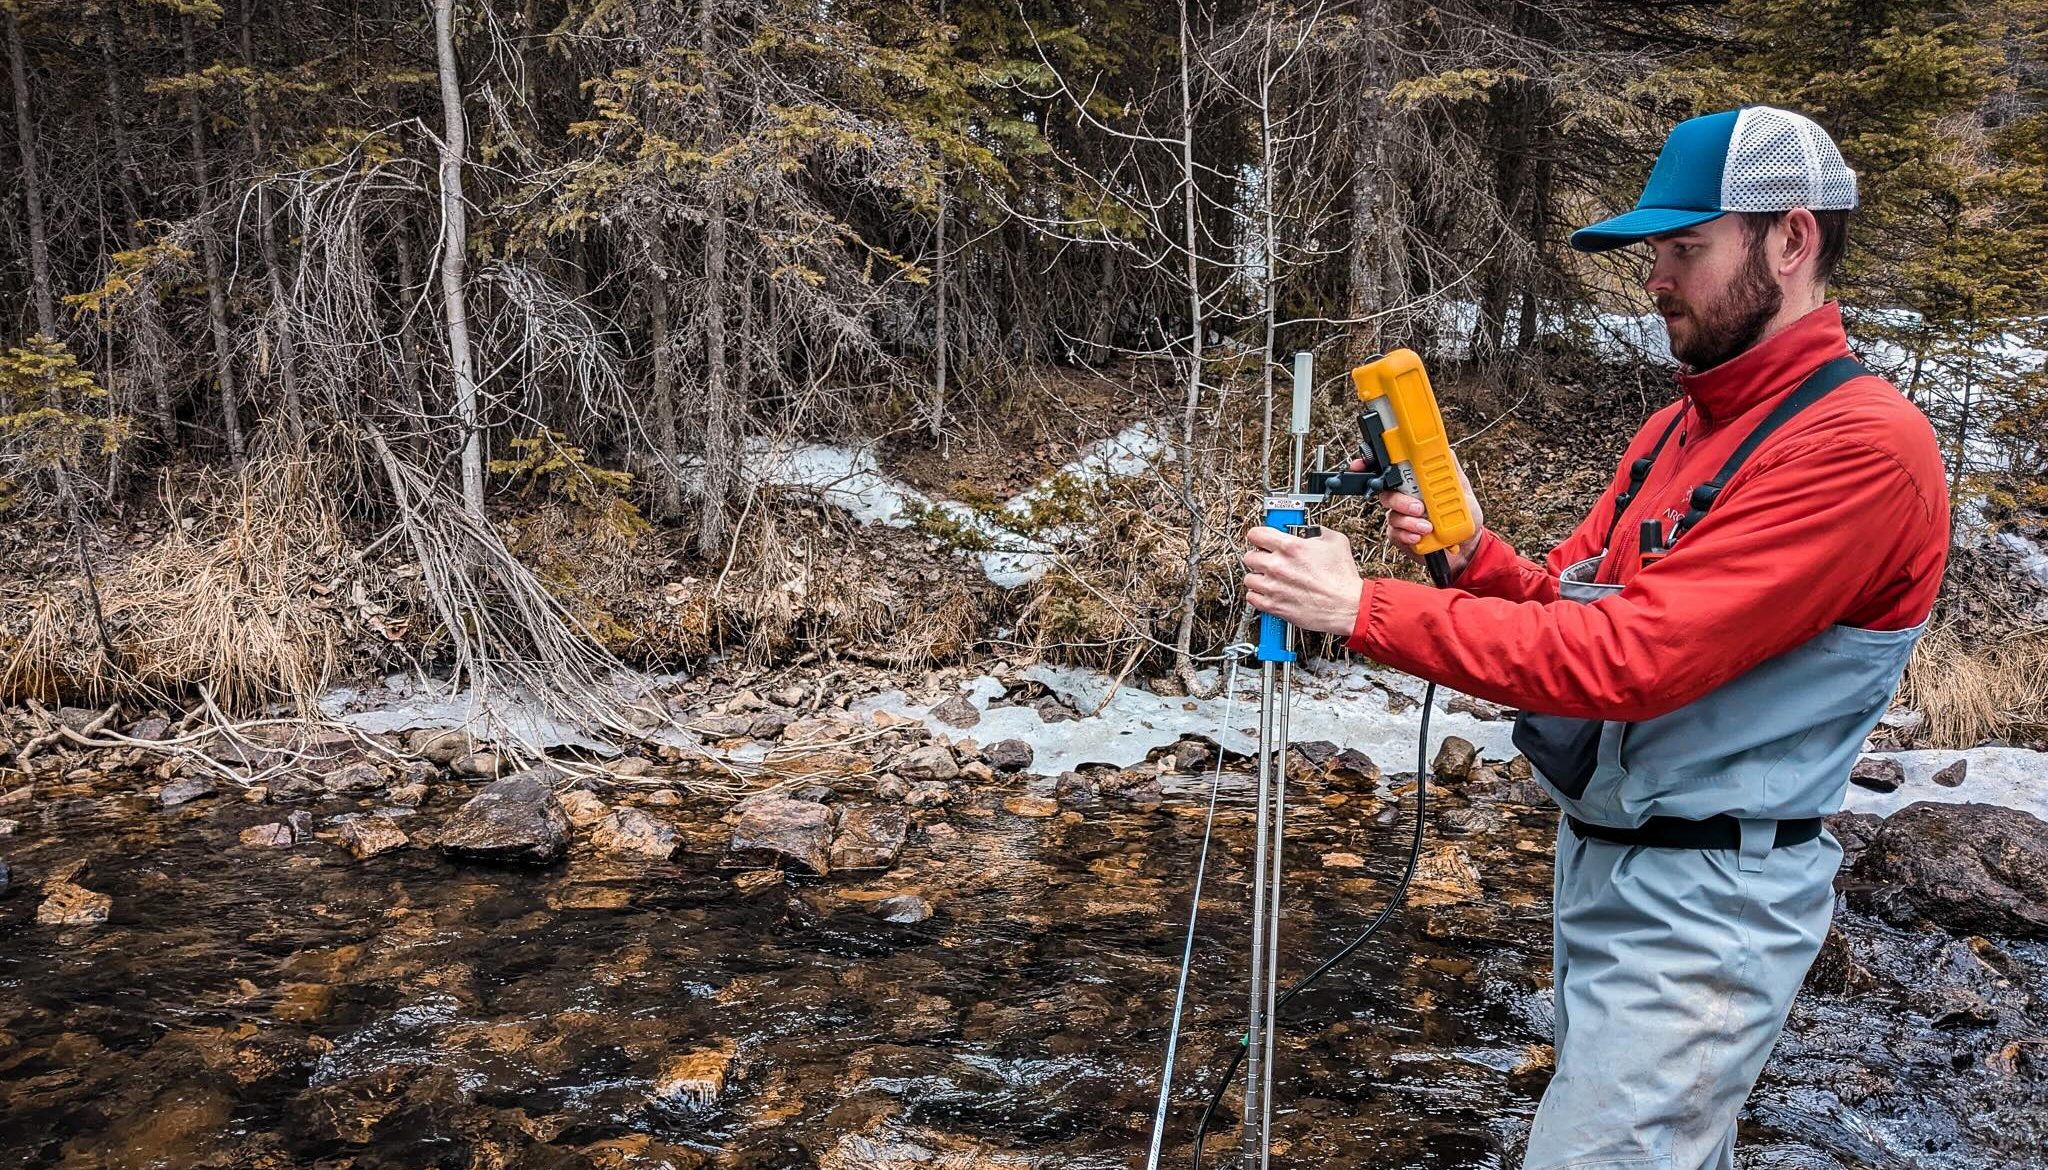
The graphing tool offers users a variety of basic data visualizations, including pie, bar, and line charts. It enables users to track key variables such as water level, discharge, and temperature over time, with the ability to zoom into specific time periods for a more detailed view. Let’s explore three data case studies from Living Lakes’ Columbia Basin Water Monitoring Framework (CBWMF), a coordinated network for tracking climate change and other impacts on water supply in southeastern British Columbia, to showcase the tool’s functionality.
Data Case Study No. 1: Bonanza Creek
Monitoring Site Established: 2023
Location: Bonanza Creek originates in the headwaters of the Selkirk Mountains, flowing between Summit Lake and Slocan Lake and into the Slocan River.
Background: Established in partnership with the Slocan Lake Stewardship Society, this hydrometric site supports restoration and monitoring efforts within the Bonanza Biodiversity Corridor as part of the Kootenay Conservation Program’s Kootenay Connect project.
Data Findings: The data collected indicates that Bonanza Creek was impacted by the drought conditions across southern British Columbia during Fall 2023 (Figure 1). In mid-January 2024, temperatures plunged to as low as -26°C, followed by unseasonably high temperatures in late January, persisting through most of February and March. These higher temperatures led to an early snowmelt, resulting in increased streamflow during late winter and early spring, while also reducing the magnitude of peak flows expected for this watershed in May and June. Data available on the Water Hub.
“The expansion of water monitoring for Bonanza Creek has greatly contributed to our ability to share knowledge and set priorities for the ongoing protection of this vital watershed and the biodiversity that it supports. The Bonanza watershed is hydrologically significant to the overall health of the Slocan watershed, supporting a wide range of wetlands and habitats.” – Wendy King, President of the Slocan Lake Stewardship Society

Data Case Study No. 2: Dunbar Creek
Monitoring Site Established: 2022
Location: Dunbar Creek originates in the headwaters of the Selkirk Mountains, including Horeb Mountain and Mt. Ethelbert, approximately 30 kilometres north of Radium Hot Springs, B.C. From its source at the high alpine Climax Lake, the creek flows through the Columbia Wetlands before joining the Columbia River.
Background: Monitoring Dunbar Creek, a tributary to the internationally recognized, Ramsar-designated Columbia Wetlands, is valuable for assessing the impacts of climate-driven glacial retreat and changes to precipitation patterns on this sensitive ecosystem. The data gathered will guide restoration and conservation efforts within the Columbia Wetlands at multiple scales.
Data findings: Flow patterns on Dunbar Creek are characterized by peaks in streamflow driven by snow and ice melt high within its mountainous headwaters (Figure 2). In spring, peak flows are delayed as the creek’s waters pass through numerous lakes within the headwaters and mid-elevations before reaching the Columbia River. In contrast, watersheds with fewer lakes experience peak flows earlier in the season. The lakes also help moderate flows during hot, dry summers by storing water upstream and slowly releasing it, which in turn, replenishes water levels in the downstream Columbia Wetlands. This also explains the “long tail” seen in the graph, which indicates a longer period of moderate flows following freshet. This pattern is less common in other streams within the CBWMF network. Data available on the Water Hub.
“The monitoring that Living Lakes Canada is doing is critically important to understanding the hydrology and water levels in the Columbia Wetlands. Dunbar Creek is one of the mid-sized creeks that we have very little data on, and we really value the important flow data that Living Lakes is collecting. These creek waters provide crucial habitat for swans and hundreds of breeding birds in the wetlands.” – Dr. Suzanne Bayley, President of Columbia Wetlands Stewardship Partners

Data Case Study No. 3: Bruce Creek
Monitoring Site Established: 2022 (for both the hydrometric monitoring site and climate station)
Location: Bruce Creek also originates in the headwaters of the Selkirk Mountains, including Sultana Peak and Mt. Nelson, located 10 kilometres northwest of Invermere, B.C. It flows into Horsethief Creek, before joining up with the Columbia River.
Background: CBWMF stream flow monitoring of Bruce Creek builds on past data from the Water Survey of Canada, enabling valuable comparisons between historical and current data. The watershed was significantly impacted by the 2023 Horsethief Creek/Bruce Mountain wildfire. This has raised concerns about potential impacts on the area’s water flows and quality, including an increased amount of sediment in the water, and the potential for greater and more frequent high flows.
Data collected from this site, along with other nearby stations, will inform a hydrological model of watersheds in the Wilmer and Lillian Lake areas to support community water supply management and watershed stewardship.
Data findings: Despite an increased likelihood for high flows, peak flows in 2024 were actually lower than in 2023 before the wildfire (Figure 3). Low snowpacks and late winter warming muted snowmelt impacts on Bruce Creek, similar to Bonanza Creek. This underscores the complex factors influencing streamflow timing and magnitude, and the importance of long-term monitoring to understand these changes on a local level. Data available on the Water Hub.
“This monitoring and assessment is essential to our planning for agriculture in the area. This will help us to plan and manage our community’s water requirements in the future.” Phil Burk, Board Member with Wilmer Waterworks District

Role of Regional Water Hubs & Community Data
Regional water hubs like the Columbia Basin Water Hub can play a key role in centralizing and managing water monitoring data through a specialized, holistic approach. By offering broader access, these hubs make water data readily available to researchers, government, students, professionals, and the public. Their focus on interoperability ensures seamless data integration across platforms, further expanding data-sharing capabilities.
“Our partnership with the Columbia Basin Water Hub showcases the value of connecting diverse data repositories to support watershed management and governance. By collaborating with regional databases like the Water Hub, we’re able to equip community water monitors and researchers with standardized, interoperable freshwater data, and empower science-based decision making.” – Claire Herbert, Data Manager with the Canadian Watershed Information Network, University of Manitoba.
These hubs also strengthen data governance by empowering local data owners and addressing community-specific needs through thoughtful engagement. This approach includes adherence to FAIR principles (Findable, Accessible, Interoperable and Reusable), the First Nation Principles of OCAP® (Ownership, Control, Access, Possession), and CARE Data Principles for Indigenous Data Governance. In doing so, it honors Indigenous data ownership and jurisdiction, and reflects a commitment to Reconciliation through water stewardship.

Living Lakes and Link Digital are collaborating to support the development of other regional data models, including an Indigenous Knowledge and Western science portal for the Nicola Watershed Governance Partnership, a government-to-government initiative between the Five Nicola First Nations and the Province of BC.
As interest in regional databases grows, communities across diverse water monitoring landscapes are increasingly embracing this model for localized water data management and stewardship. By making water data accessible, supporting Indigenous data sovereignty, responding to the needs of data contributors, and continuously improving data visualization and understanding, the Water Hub will continue to provide the foundation needed to strengthen climate resilience in communities and support the path towards a water-secure future.
The CBWMF datasets on the Columbia Basin Water Hub, now updated with 2024 data, will have the graphing tool available by the end of November 2024. Data users and contributors can expect the tool to be enabled on all datasets in early 2025.
The full Watershed Bulletin is available as a flipbook and PDF.